Blog page

Using eBPF and predefined inspections to minimize observability tax
Learn how to make observability easy with eBPF
Read moreKafka Monitoring with eBPF: It’s a Whole New Perspective
Learning why Kafak monitoring needs eBPF
Read more
eBPF and its capabilities
A quick introduction to eBPF and how Exness uses it with Tetragon
Read more
How the Hive Came To Bee – a story of eBPF and Cilium so far
Learn the history, technical deep dive, and use cases of eBPF with accompanying videos
Read more
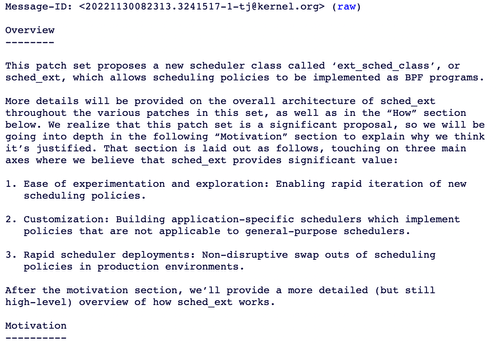
Experimental Patches Allow eBPF To Extend The Linux Kernel's Scheduler
RFC patches to allow for application-specific schedulers and other customizable options via the loading of custom BPF programs
Read more
How we diagnosed and resolved Redis latency spikes with BPF and other tools
Learn how they used tools like BCC and bpftract to resolve a performance issue
Read more
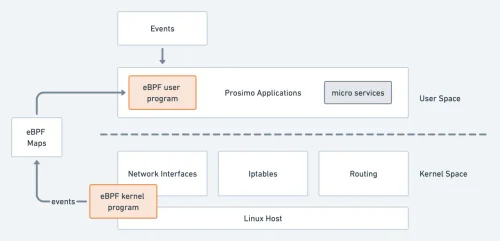
Harnessing the Power of eBPF
Learn how eBPF can be used for Packet Decapsulation, Service Chaining, Network Policy, and Debugging and Observability
Read more
eBPF: Fantastic [Network & I/O] Speeds and Where To Find Them
A quick intro to eBPF and a deep dive into three different use cases and how they work
Read more
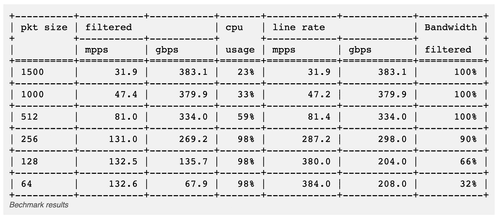
High Performance GeoIP Blocking in eBPF with XDP
Learn how to block traffic based on IP location and the impact it has on performance
Read more
A practical guide to capturing production traffic with eBPF
Learn how to create a eBPF-based protocol tracer for HTTP session traffic and the challenges along the way
Read more